
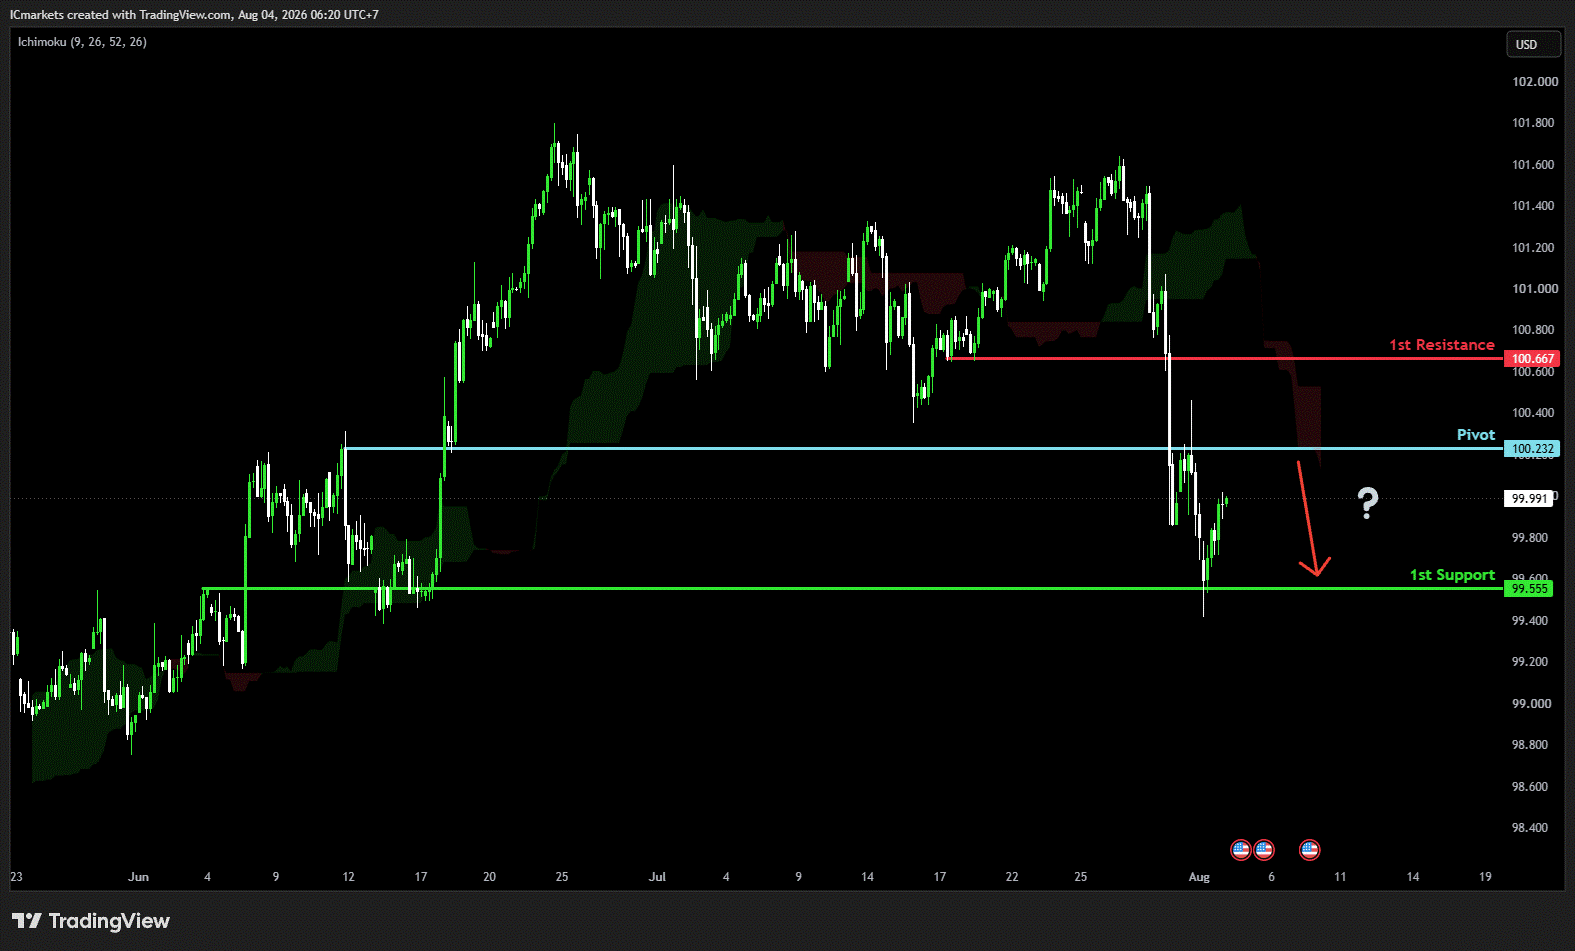
DXY (U.S. Dollar Index):
Potential Direction: Bearish
Overall momentum of the chart: Bearish
The price could see a short-term pullback toward the pivot before continuing its bearish move down toward the 1st support.
Pivot: 100.23
Supporting reasons: Identified as an overlap resistance, where selling pressures could intensify and potentially cap any upward retracement
1st support: 99.55
Supporting reasons: Identified as an overlap support, indicating a potential area where the price could again stabilize.
1st resistance: 100.66
Supporting reasons: Identified as a pullback resistance, indicating a potential area that could halt any further upward movement
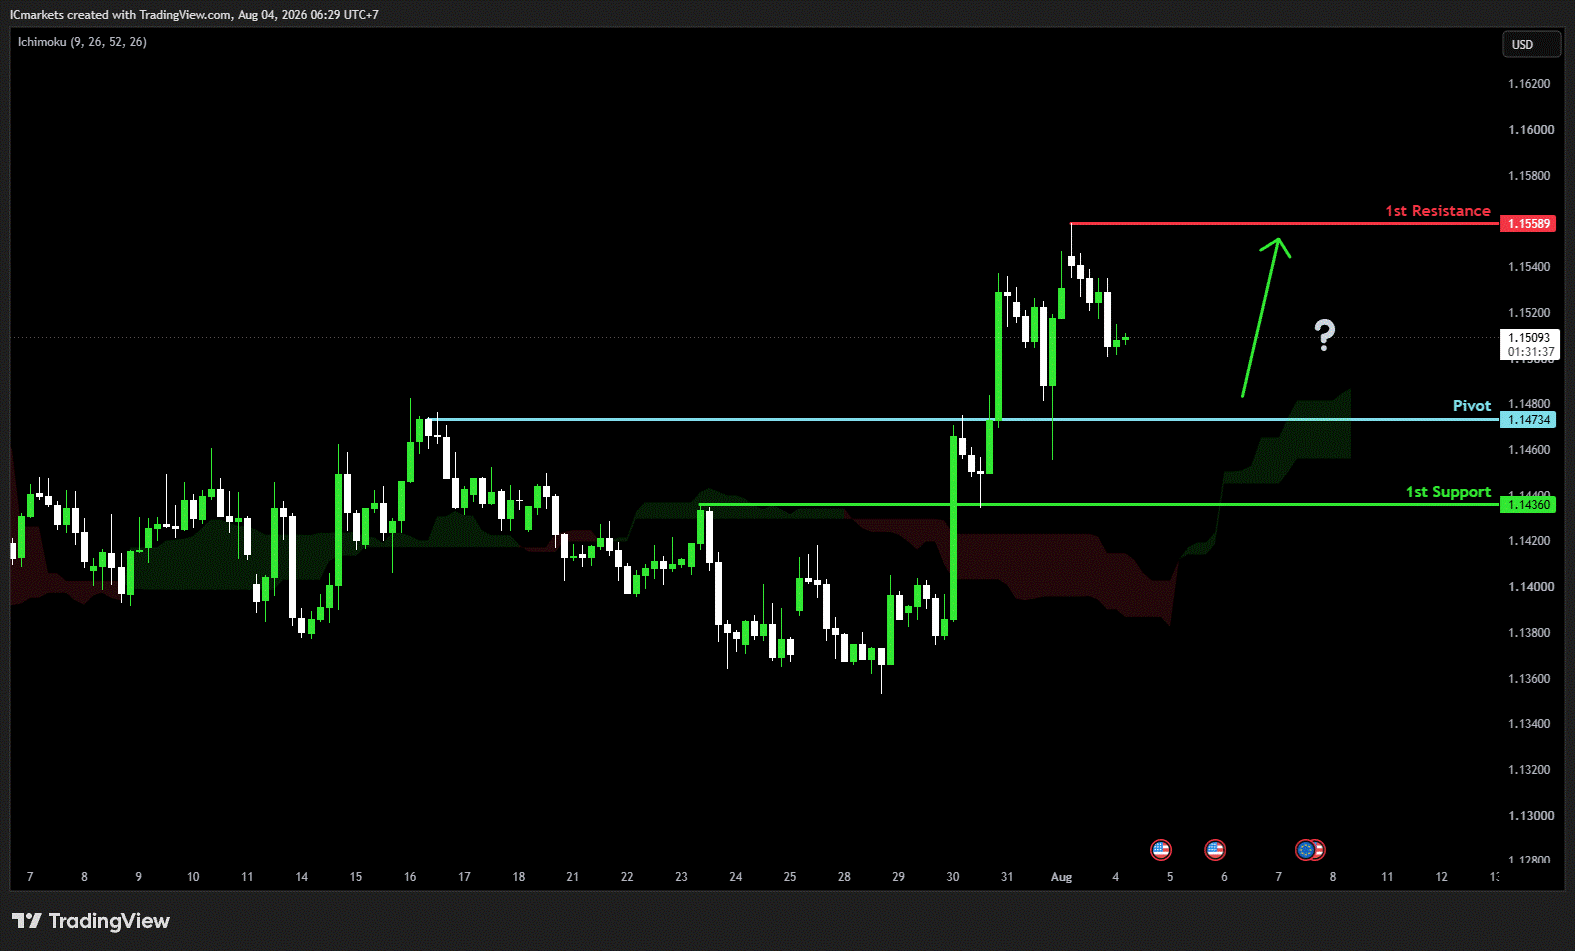
EUR/USD:
Potential Direction: Bullish
Overall momentum of the chart: Bullish
The price could make a short-term pullback toward the pivot before rising again toward the 1st resistance
Pivot: 1.1473
Supporting reasons: Identified as an overlap support, where renewed buying pressure could emerge to push the price higher.
1st support: 1.1436
Supporting reasons: Identified as an overlap support, indicating a potential level where the price could stabilize once again
1st resistance: 1.1558
Supporting reasons: Identified as a swing high resistance, indicating a potential level that could cap further upward movement.
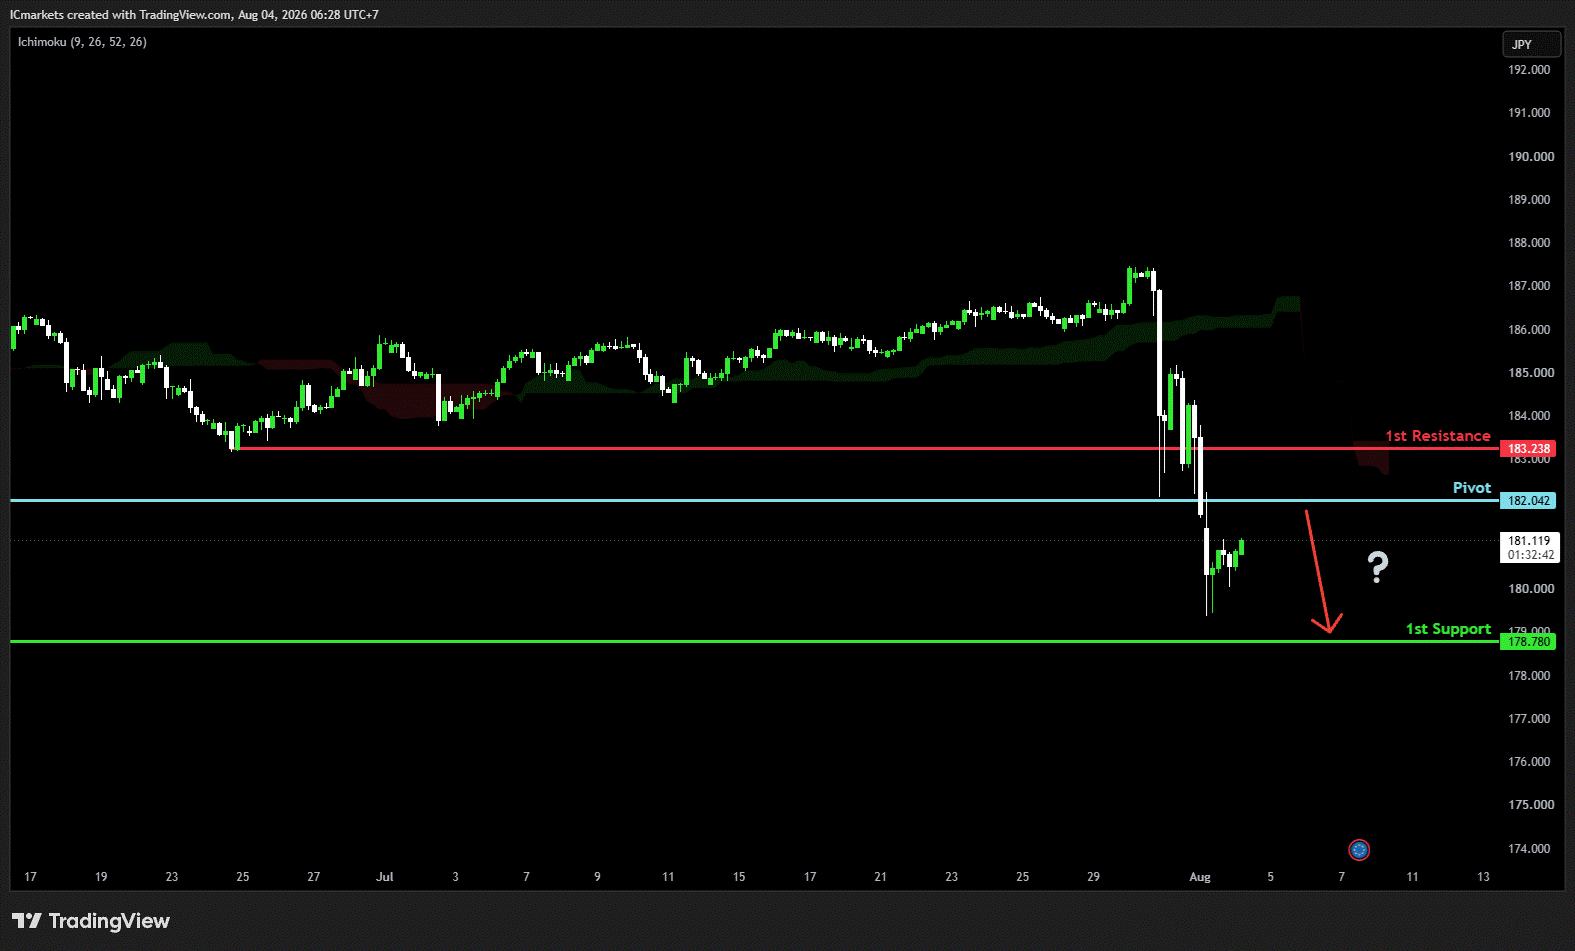
EUR/JPY:
Potential Direction: Bearish
Overall momentum of the chart: Bearish
The price could see a short-term pullback toward the pivot before continuing its bearish move down toward the 1st support.
Pivot: 182.04
Supporting reasons: Identified as a pullback resistance, where selling pressures could intensify and potentially cap any upward retracement
1st support: 178.78
Supporting reasons: Identified as a pullback support, indicating a potential area where the price could again stabilize.
1st resistance: 183.23
Supporting reasons: Identified as a pullback resistance, indicating a potential level that could cap further upward movement.
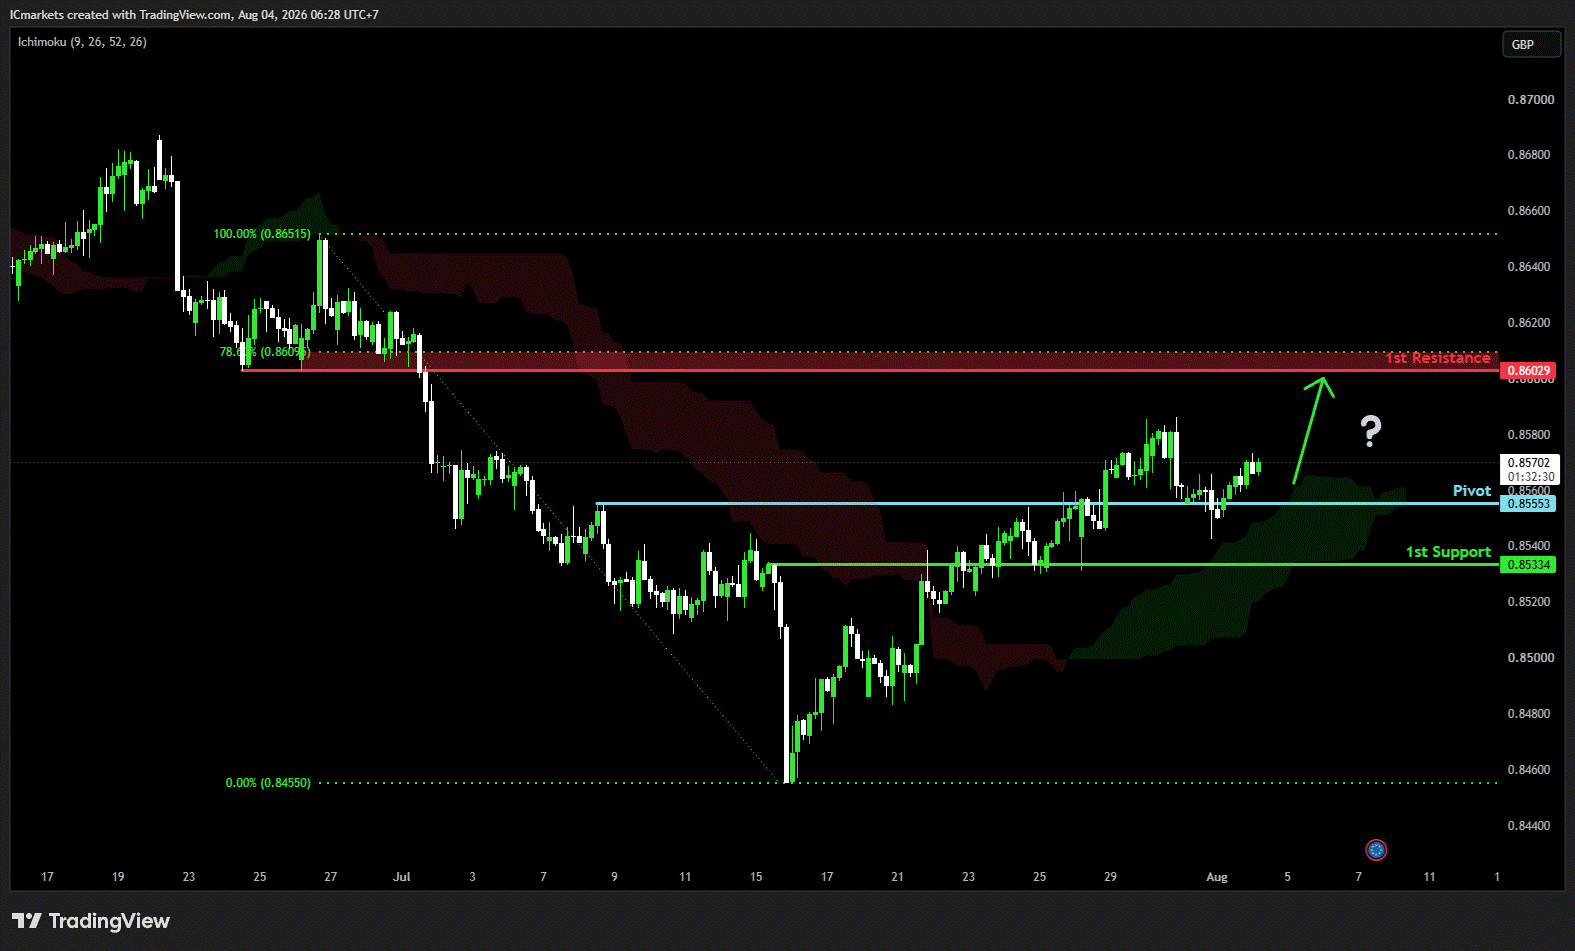
EUR/GBP:
Potential Direction: Bullish
Overall momentum of the chart: Bearish
The price could make a short-term pullback toward the pivot before rising again toward the 1st resistance
Pivot: 0.8555
Supporting reasons: Identified as a pullback support, where renewed buying pressure could emerge to push the price higher.
1st support: 0.8533
Supporting reasons: Identified as a swing low support that indicates a potential area where the price could stabilize once more.
1st resistance: 0.8620
Supporting reasons: Identified as a pullback resistance that aligns with the 78.6% Fibonacci retracement, indicating a potential level that could cap further upward movement.
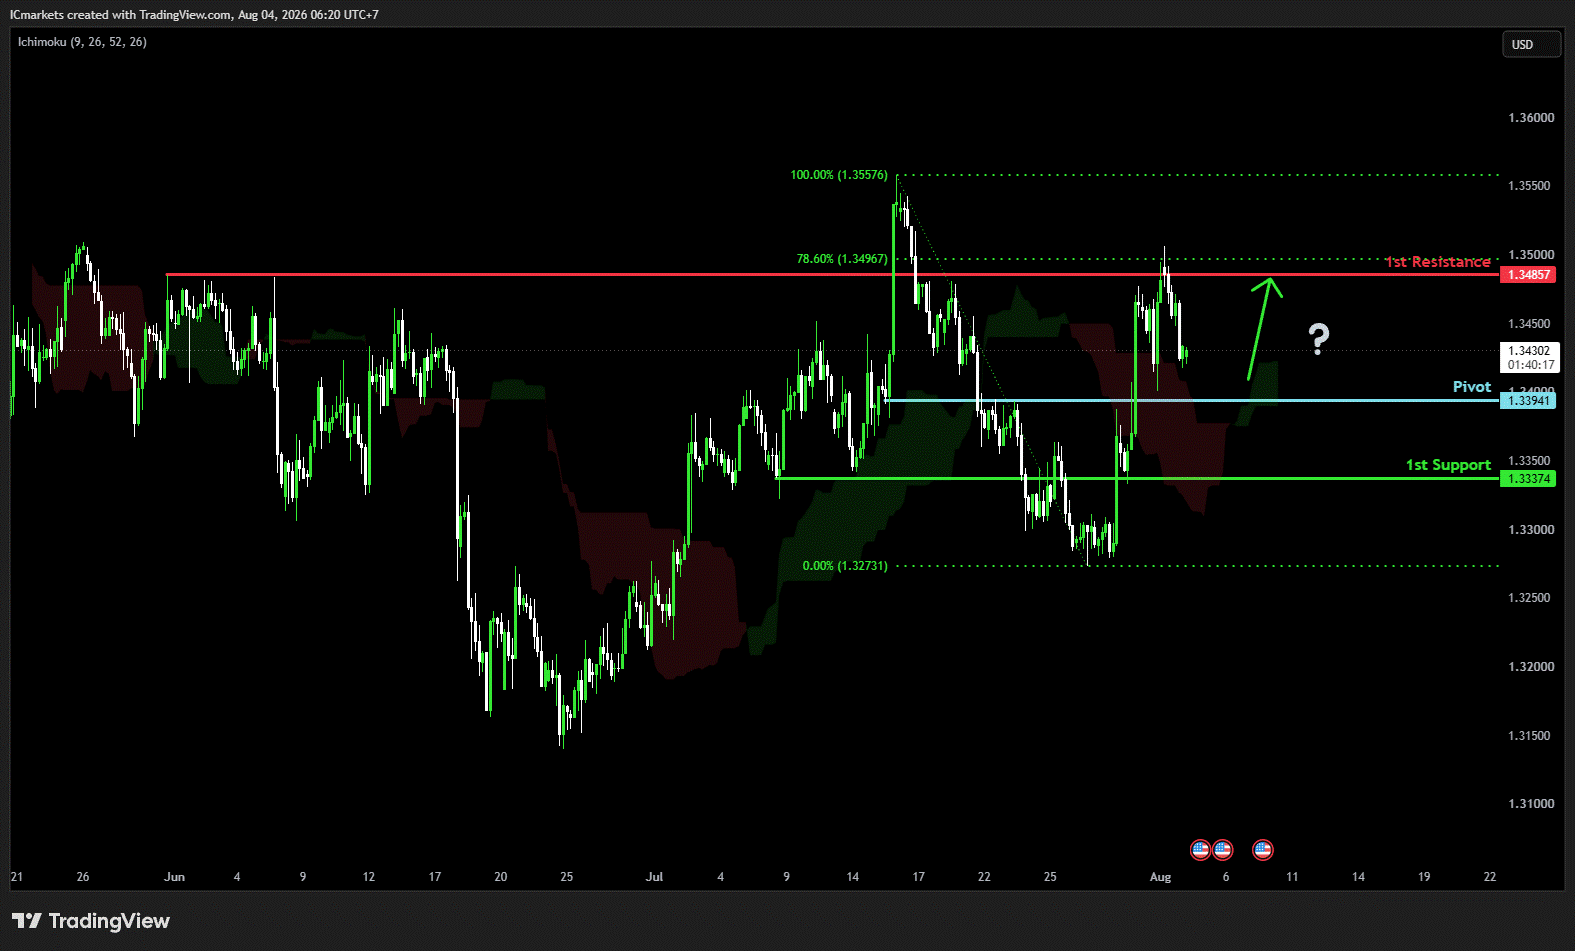
GBP/USD:
Potential Direction: Bullish
Overall momentum of the chart: Bullish
The price could make a short-term pullback toward the pivot before rising again toward the 1st resistance
Pivot: 1.3394
Supporting reasons: Identified as a pullback support, where renewed buying pressure could emerge to push the price higher.
1st support: 1.3337
Supporting reasons: Identified as an overlap support, indicating a potential area where the price could stabilize once more.
1st resistance: 1.3485
Supporting reasons: Identified as an overlap resistance that aligns with the 78.6% Fibonacci retracement, indicating a potential level that could halt further upward movement.
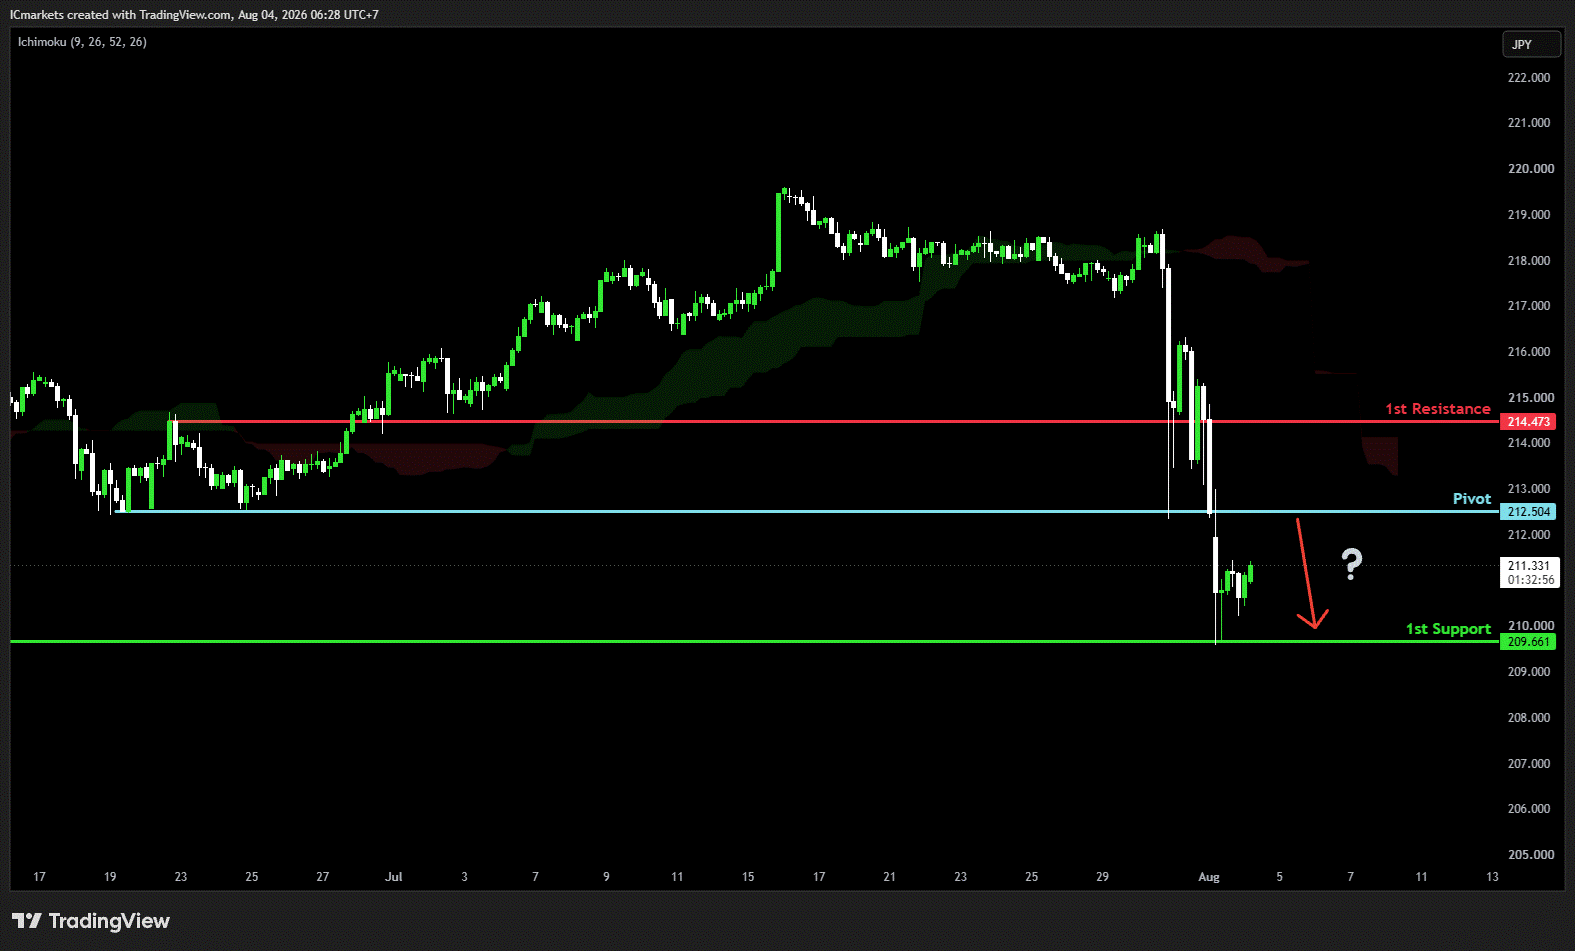
GBP/JPY:
Potential Direction: Bearish
Overall momentum of the chart: Bullish
The price could see a short-term pullback toward the pivot before continuing its bearish move down toward the 1st support.
Pivot: 212.50
Supporting reasons: Identified as a pullback resistance, where selling pressures could intensify and potentially cap any upward retracement
1st support: 209.66
Supporting reasons: Identified as a pullback support, indicating a potential level where the price could stabilize once more.
1st resistance: 214.47
Supporting reasons: Identified as pullback resistance, indicating a potential level that could halt further upward movement.
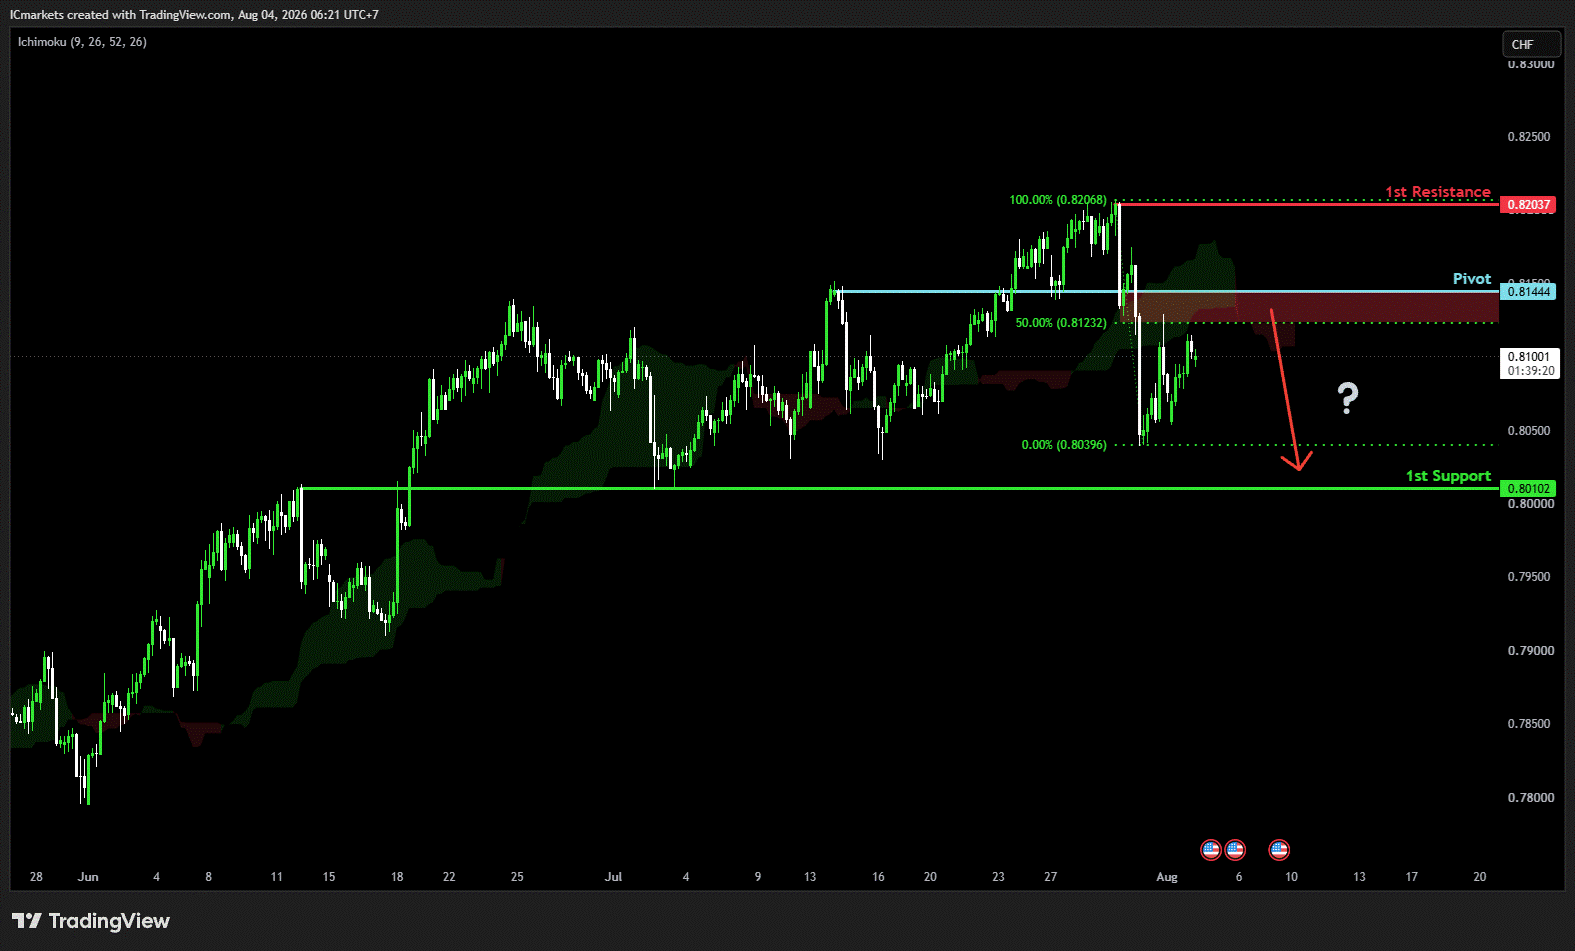
USD/CHF:
Potential Direction: Bearish
Overall momentum of the chart: Bearish
The price could see a short-term pullback toward the pivot before continuing its bearish move down toward the 1st support.
Pivot: 0.8144
Supporting reasons: Identified as a pullback resistance, where selling pressures could intensify and potentially cap any upward retracement
1st support: 0.8010
Supporting reasons: Identified as an overlap support, indicating a potential level where the price could stabilize once again.
1st resistance: 0.8203
Supporting reasons: Identified as a swing high resistance, indicating a potential level that could cap further upward movement.
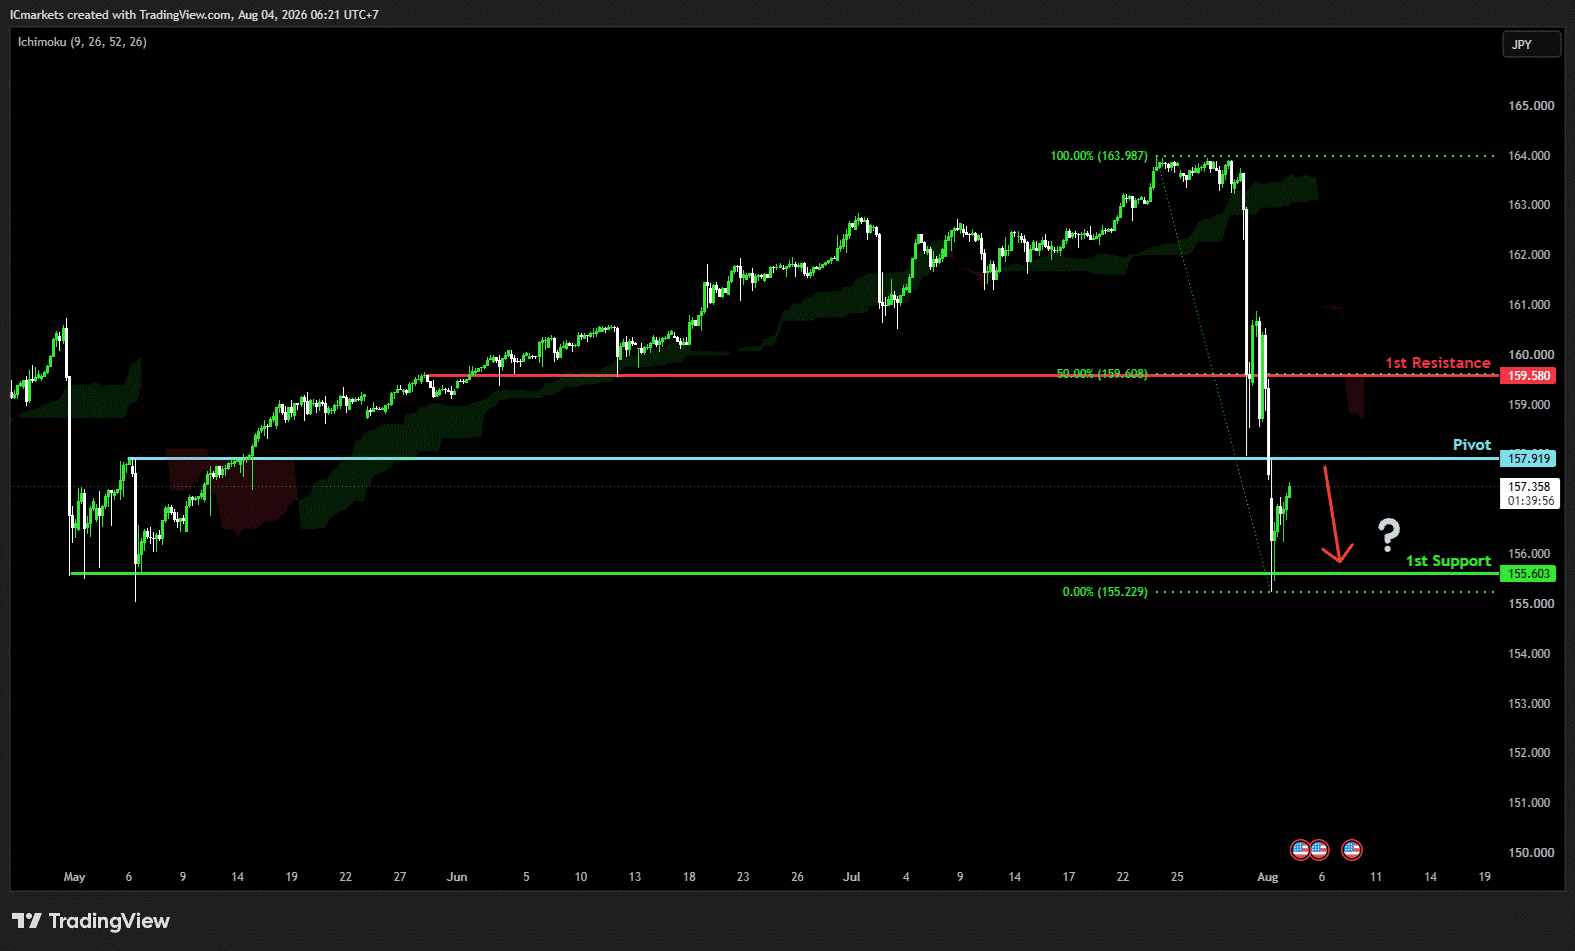
USD/JPY:
Potential Direction: Bearish
Overall momentum of the chart: Bullish
The price could see a short-term pullback toward the pivot before continuing its bearish move down toward the 1st support.
Pivot: 157.91
Supporting reasons: Identified as a pullback resistance, where selling pressures could intensify and potentially cap any upward retracement
1st support: 155.60
Supporting reasons: Identified as a swing low support, indicating a strong area where buyers might return, and the price could stabilize once again.
1st resistance: 159.58
Supporting reasons: Identified as a pullback resistance that aligns with the 50% Fibonacci retracement. This level represents the next key area where upward movement could be capped amid increased selling pressure
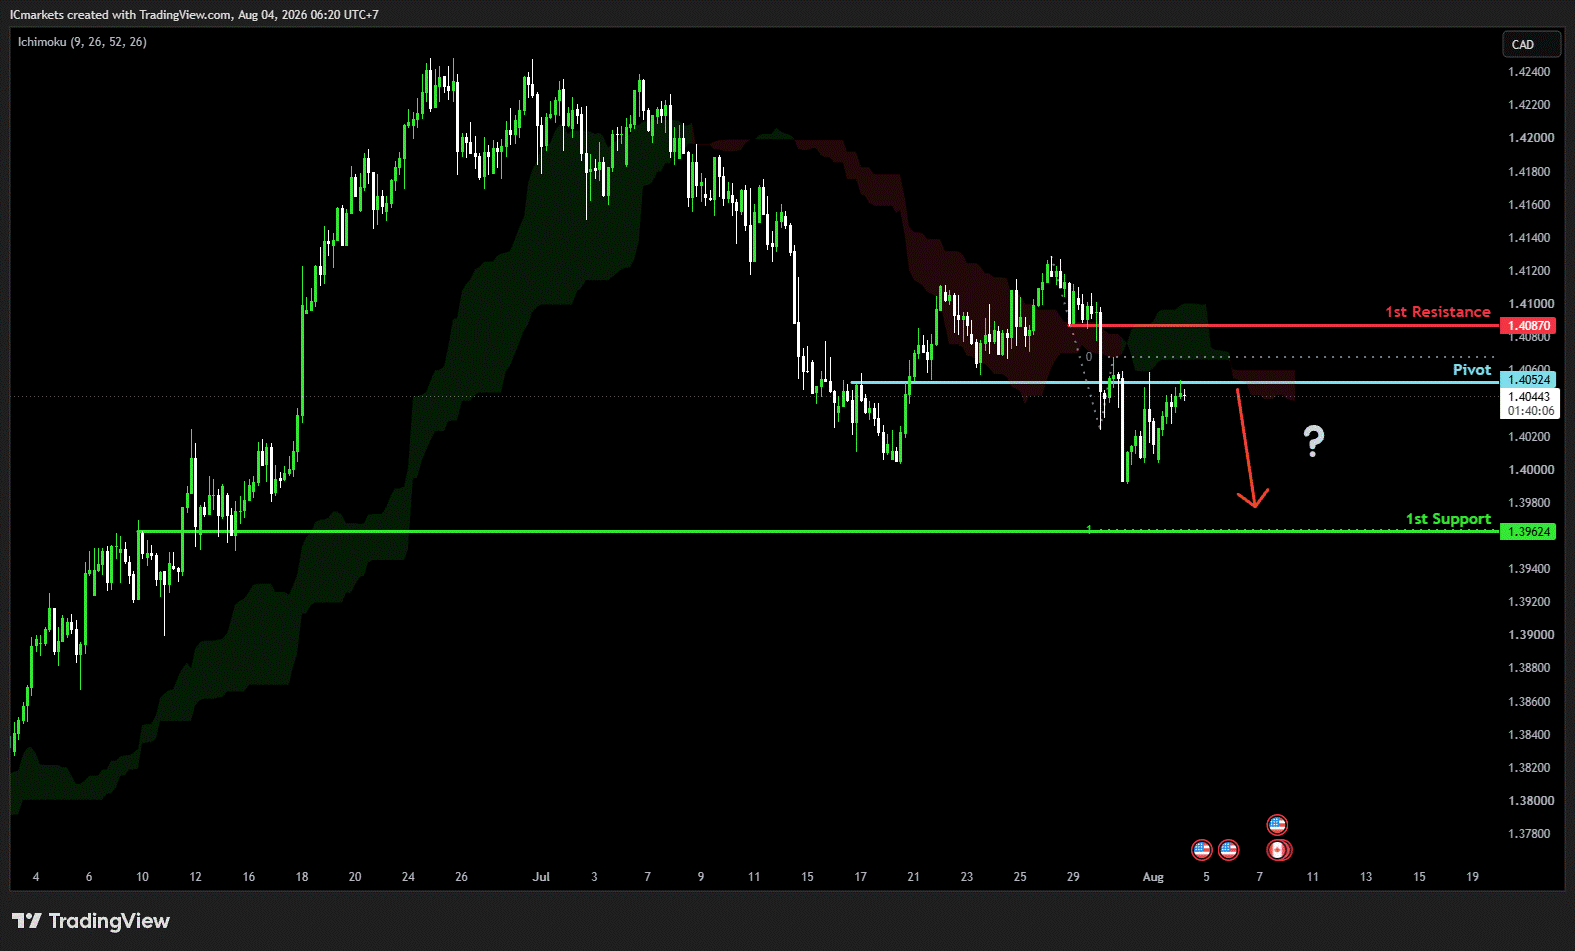
USD/CAD:
Potential Direction: Bearish
Overall momentum of the chart: Bearish
The price could see a short-term pullback toward the pivot before continuing its bearish move down toward the 1st support.
Pivot: 1.4052
Supporting reasons: Identified as a pullback resistance, where selling pressures could intensify and potentially cap any upward retracement
1st support: 1.3962
Supporting reasons: Identified as an overlap support that aligns with the 100% Fibonacci projection, indicating a key level where the price could stabilize once more.
1st resistance: 1.4087
Supporting reasons: Identified as a pullback resistance, making it a possible target for bullish advances and a level where some sellers could return to cap gains
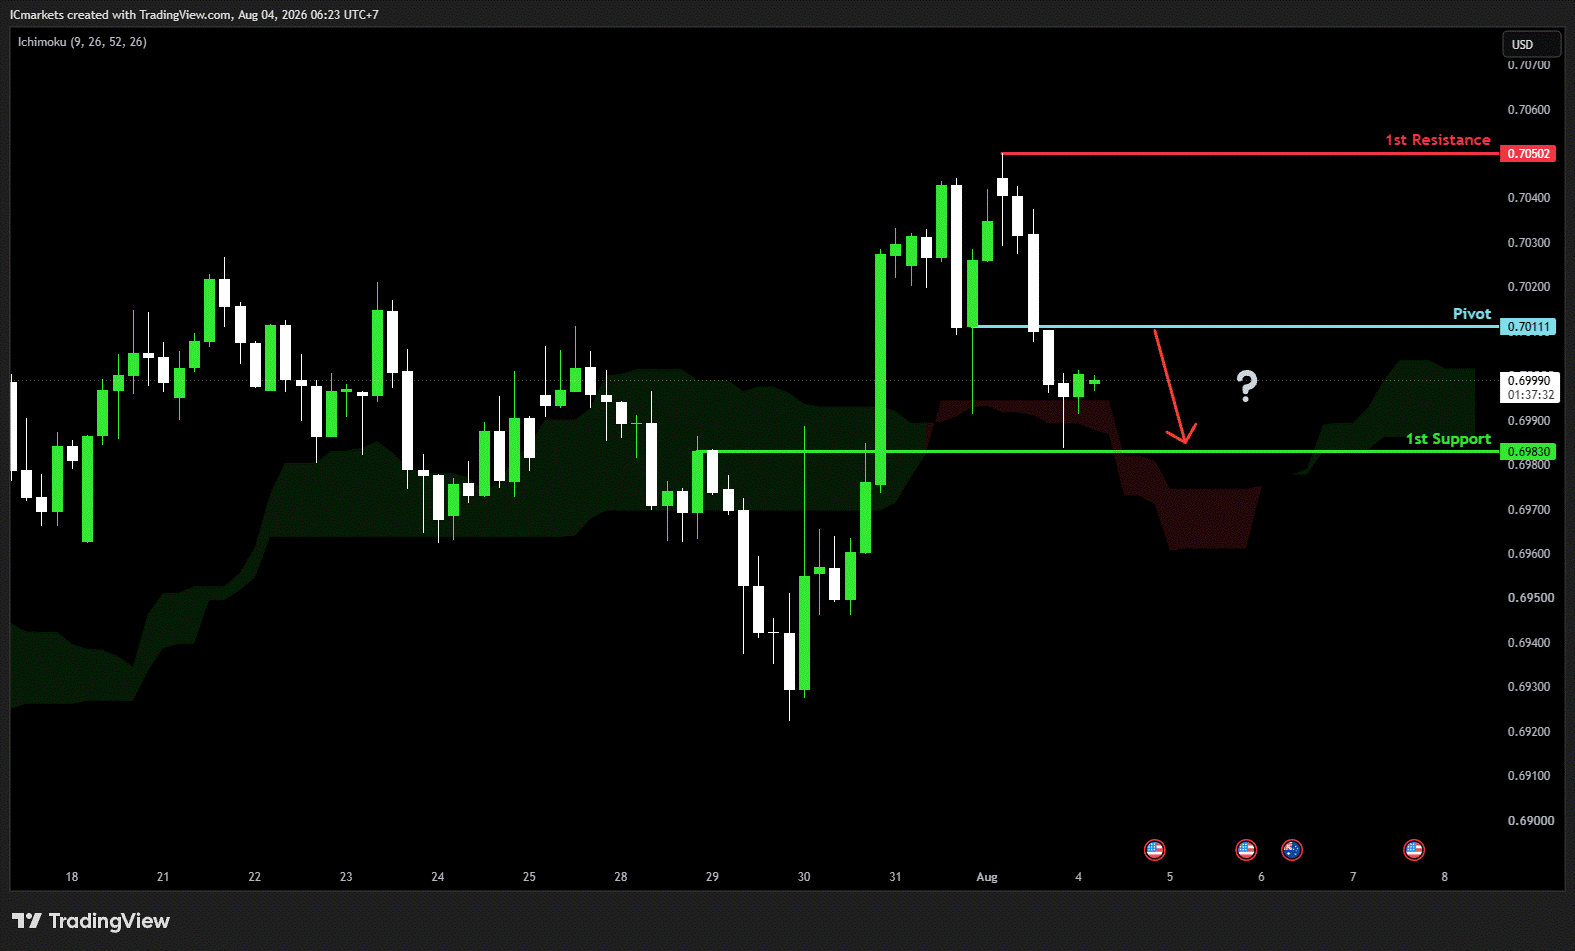
AUD/USD:
Potential Direction: Bearish
Overall momentum of the chart: Bullish
The price could see a short-term pullback toward the pivot before continuing its bearish move down toward the 1st support.
Pivot: 0.7011
Supporting reasons: Identified as a pullback resistance, where selling pressures could intensify and potentially cap any upward retracement
1st support: 0.6983
Supporting reasons: Identified as a pullback support; this area has provided strong support historically and may attract buying interest for a potential short-term bounce
1st resistance: 0.7050
Supporting reasons: Identified as a swing high resistance, indicating a potential area that could halt any further upward movement.
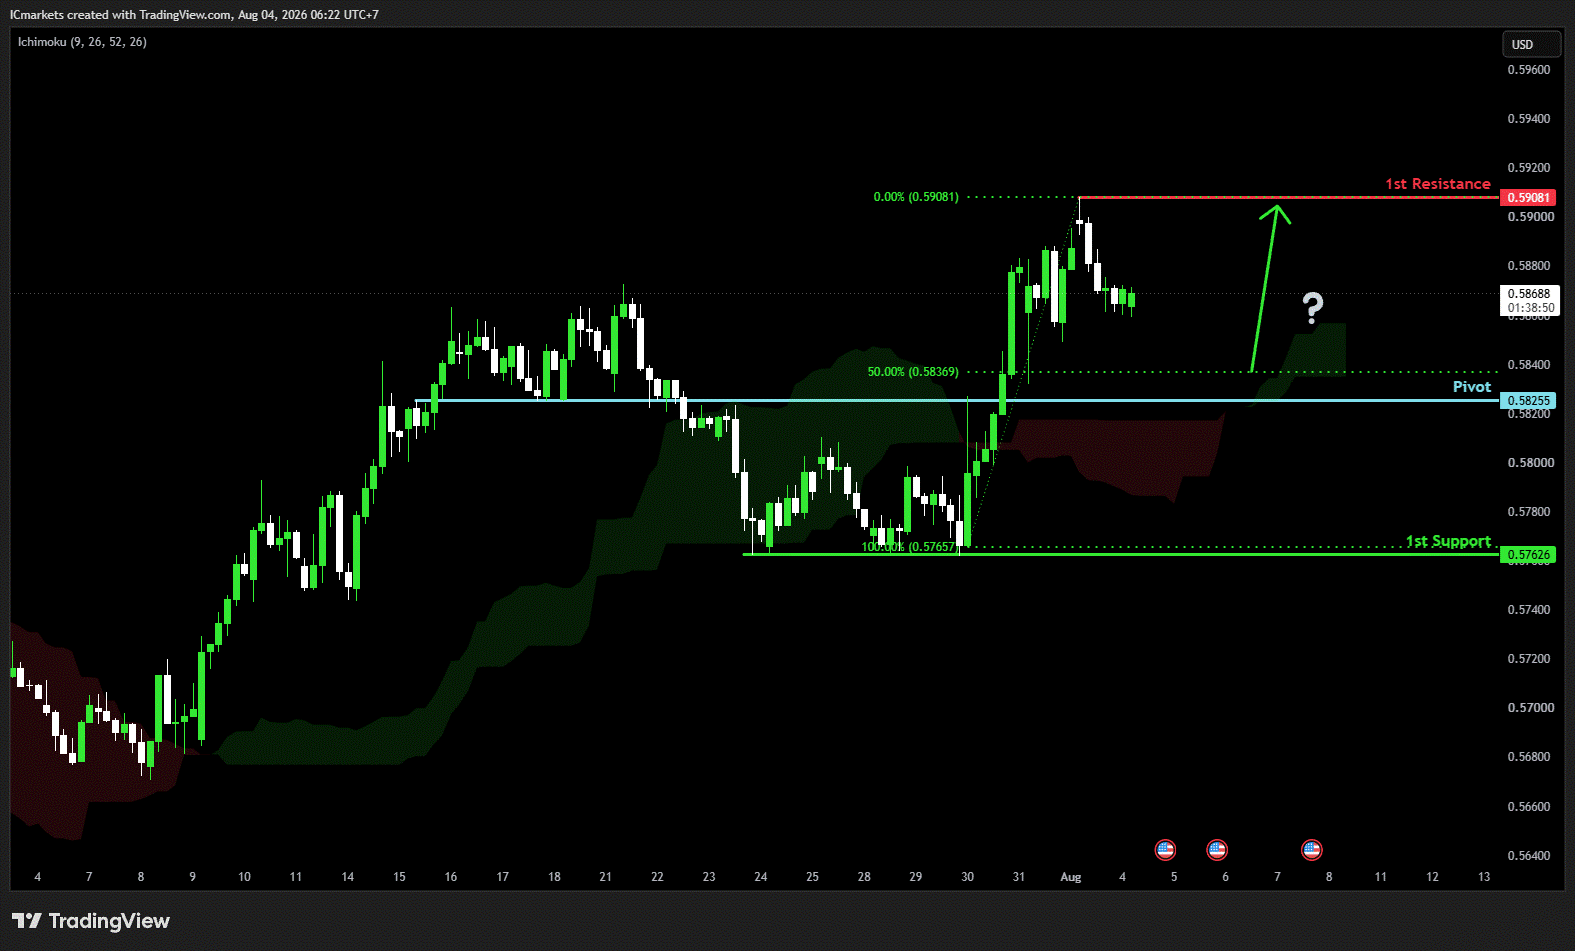
NZD/USD
Potential Direction: Bullish
Overall momentum of the chart: Bullish
The price could make a short-term pullback toward the pivot before rising again toward the 1st resistance
Pivot: 0.5825
Supporting reasons: Identified as a pullback support, where renewed buying pressure could emerge to push the price higher.
1st support: 0.5762
Supporting reasons: Identified as a swing low support; this area has provided strong support historically and may attract buying interest for a potential short-term bounce
1st resistance: 0.5908
Supporting reasons: Identified as a swing high resistance, indicating a potential area that could halt any further upward movement.
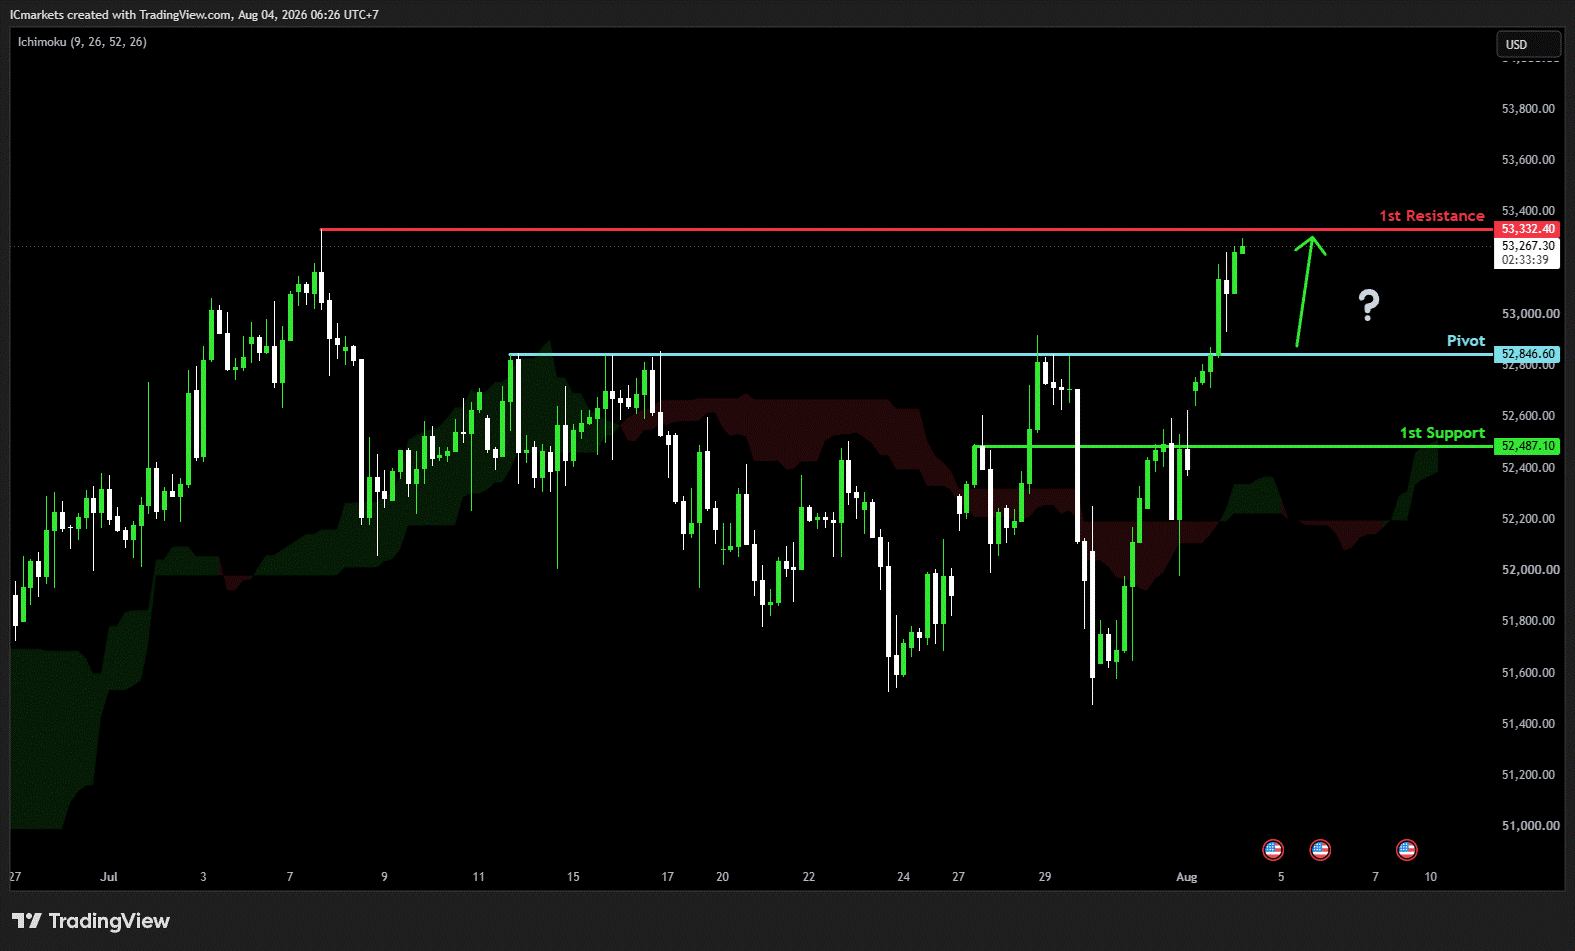
US30 (DJIA):
Potential Direction: Bullish
Overall momentum of the chart: Bullish
The price could make a short-term pullback toward the pivot before rising again toward the 1st resistance
Pivot: 52,846.60
Supporting reasons: Identified as a pullback support, where renewed buying pressure could emerge to push the price higher.
1st support: 52,487.10
Supporting reasons: Identified as a pullback support, suggesting a potential area where the price could stabilize once again.
1st resistance: 53,332.40
Supporting reasons: Identified as a swing high resistance, indicating a potential area that could halt any further upward movement.
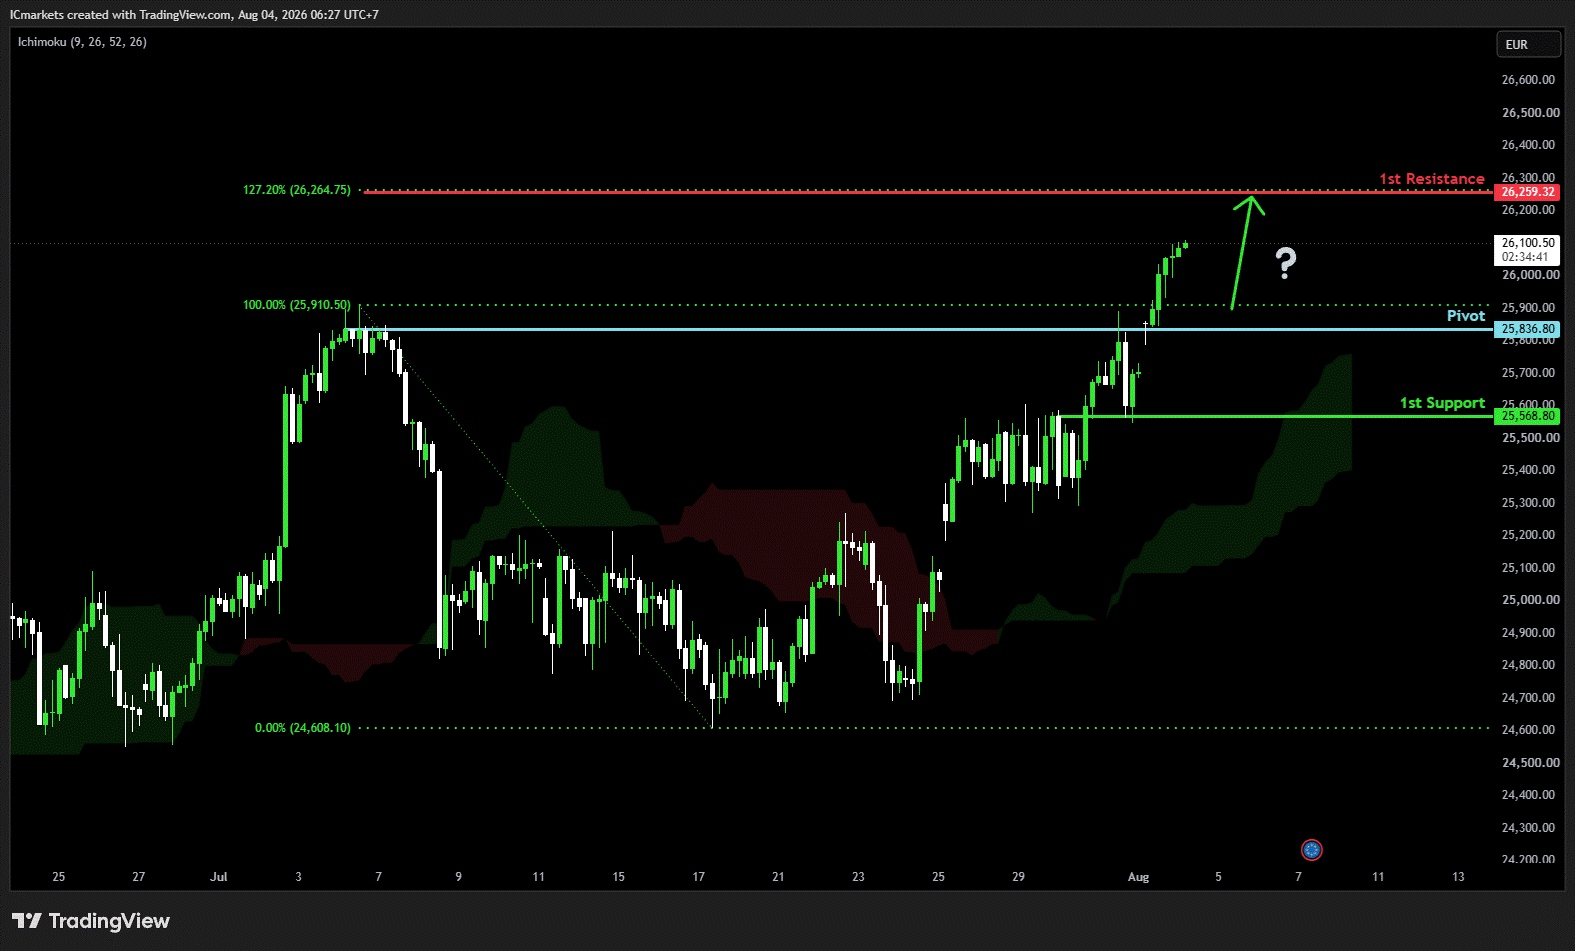
DE40 (DAX):
Potential Direction: Bullish
Overall momentum of the chart: Bullish
The price could make a short-term pullback toward the pivot before rising again toward the 1st resistance
Pivot: 25,836.80
Supporting reasons: Identified as a pullback support, where renewed buying pressure could emerge to push the price higher.
1st support: 25,568.80
Supporting reasons: Identified as an overlap support, indicating a key level where the price could stabilize once more.
1st resistance: 26,259.32
Supporting reasons: Identified as a resistance that aligns with the 127.2% Fibonacci extension, indicating a potential area that could halt any further upward movement.
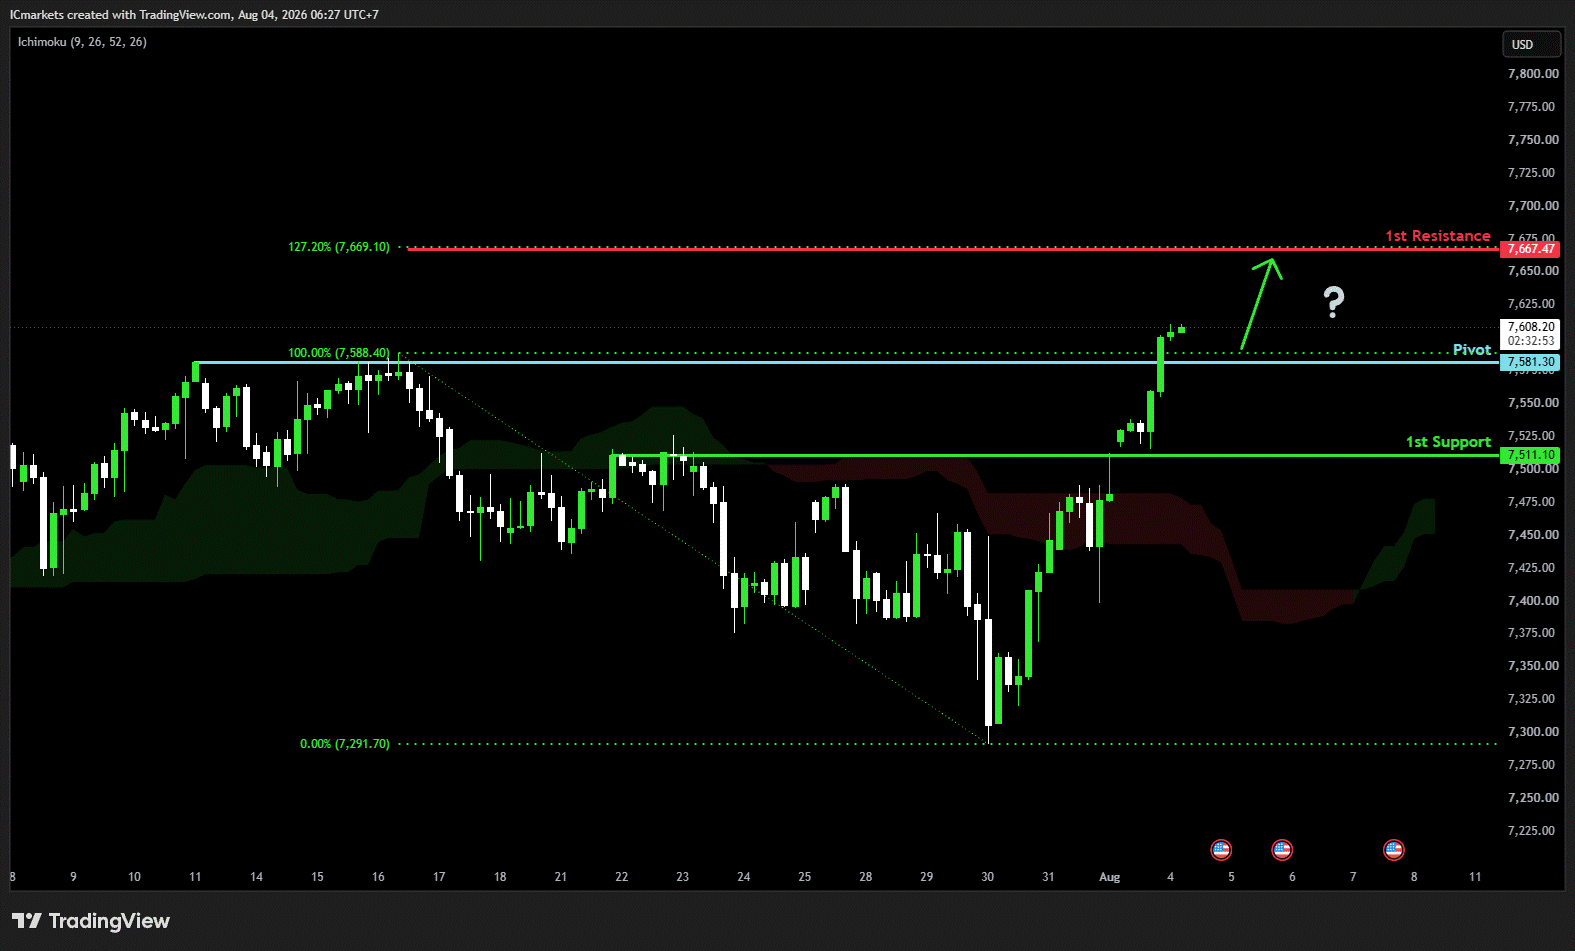
US500 (S&P 500):
Potential Direction: Bullish
Overall momentum of the chart: Bullish
The price could make a short-term pullback toward the pivot before rising again toward the 1st resistance
Pivot: 7,581.30
Supporting reasons: Identified as a pullback support, where renewed buying pressure could emerge to push the price higher.
1st support: 7,511.10
Supporting reasons: Identified as an overlap support, indicating a potential level where the price could stabilize once again.
1st resistance: 7,667.47
Supporting reasons: Identified as a resistance that aligns with the 127.2% Fibonacci extension, indicating a potential area that could halt any further upward movement.
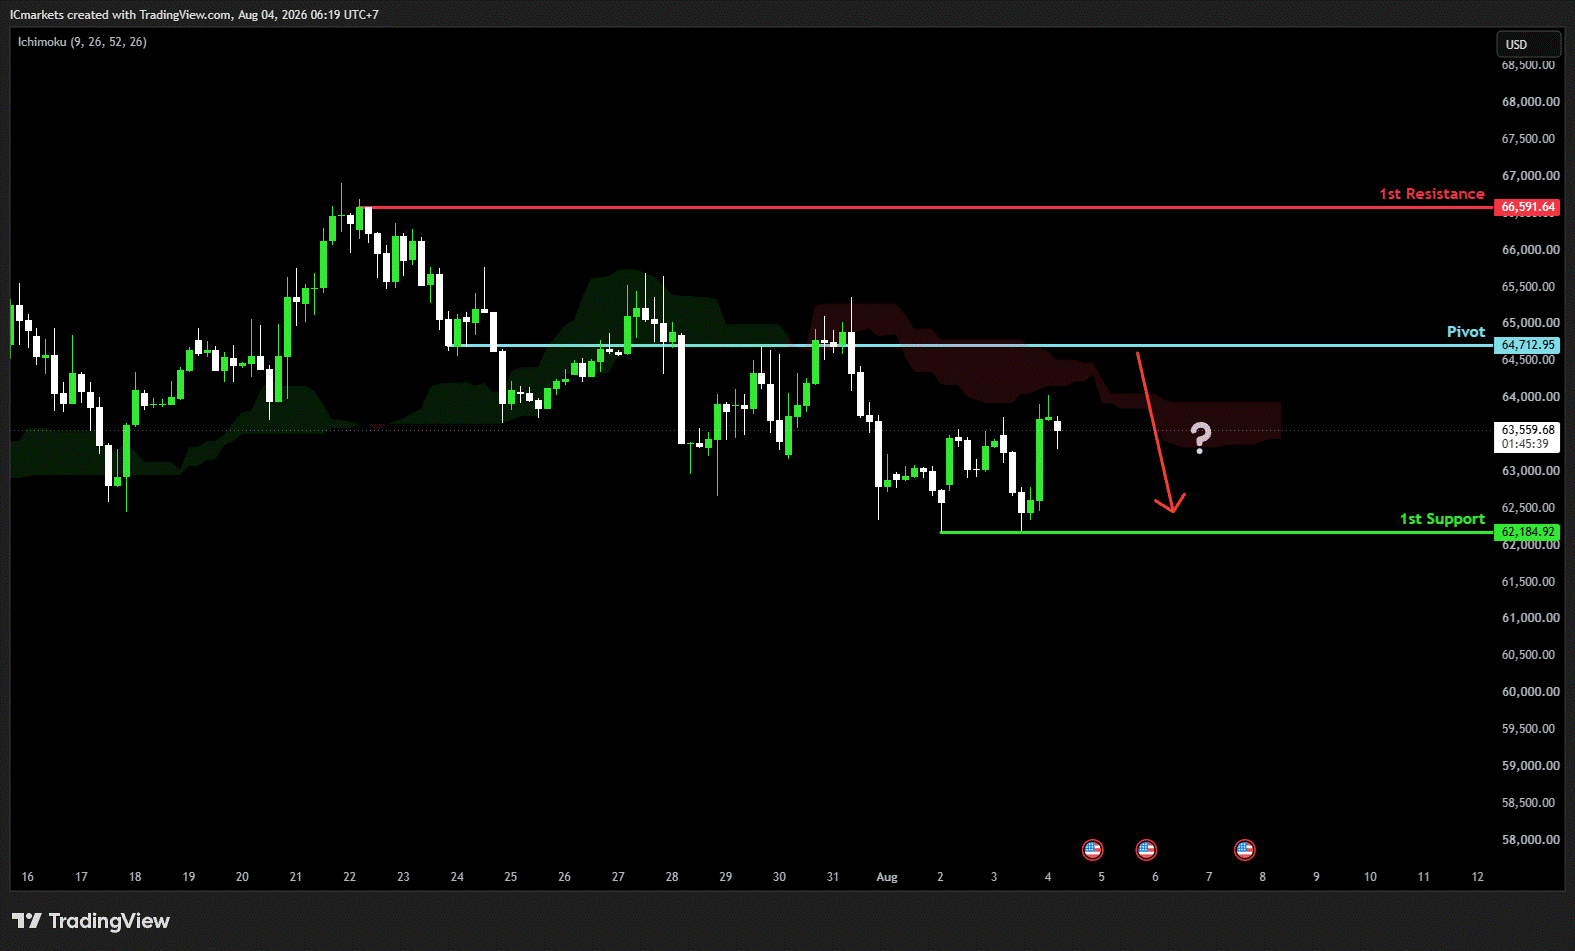
BTC/USD (Bitcoin):
Potential Direction: Bearish
Overall momentum of the chart: Bullish
The price could see a short-term pullback toward the pivot before continuing its bearish move down toward the 1st support.
Pivot: 64,712.95
Supporting reasons: Identified as a pullback resistance, where selling pressures could intensify and potentially cap any upward retracement
1st support: 62,184.92
Supporting reasons: Identified as a swing low support, indicating a potential level where the price could stabilize once more.
1st resistance: 66,591.64
Supporting reasons: Identified as a swing high resistance, indicating a potential area that could halt any further upward movement.
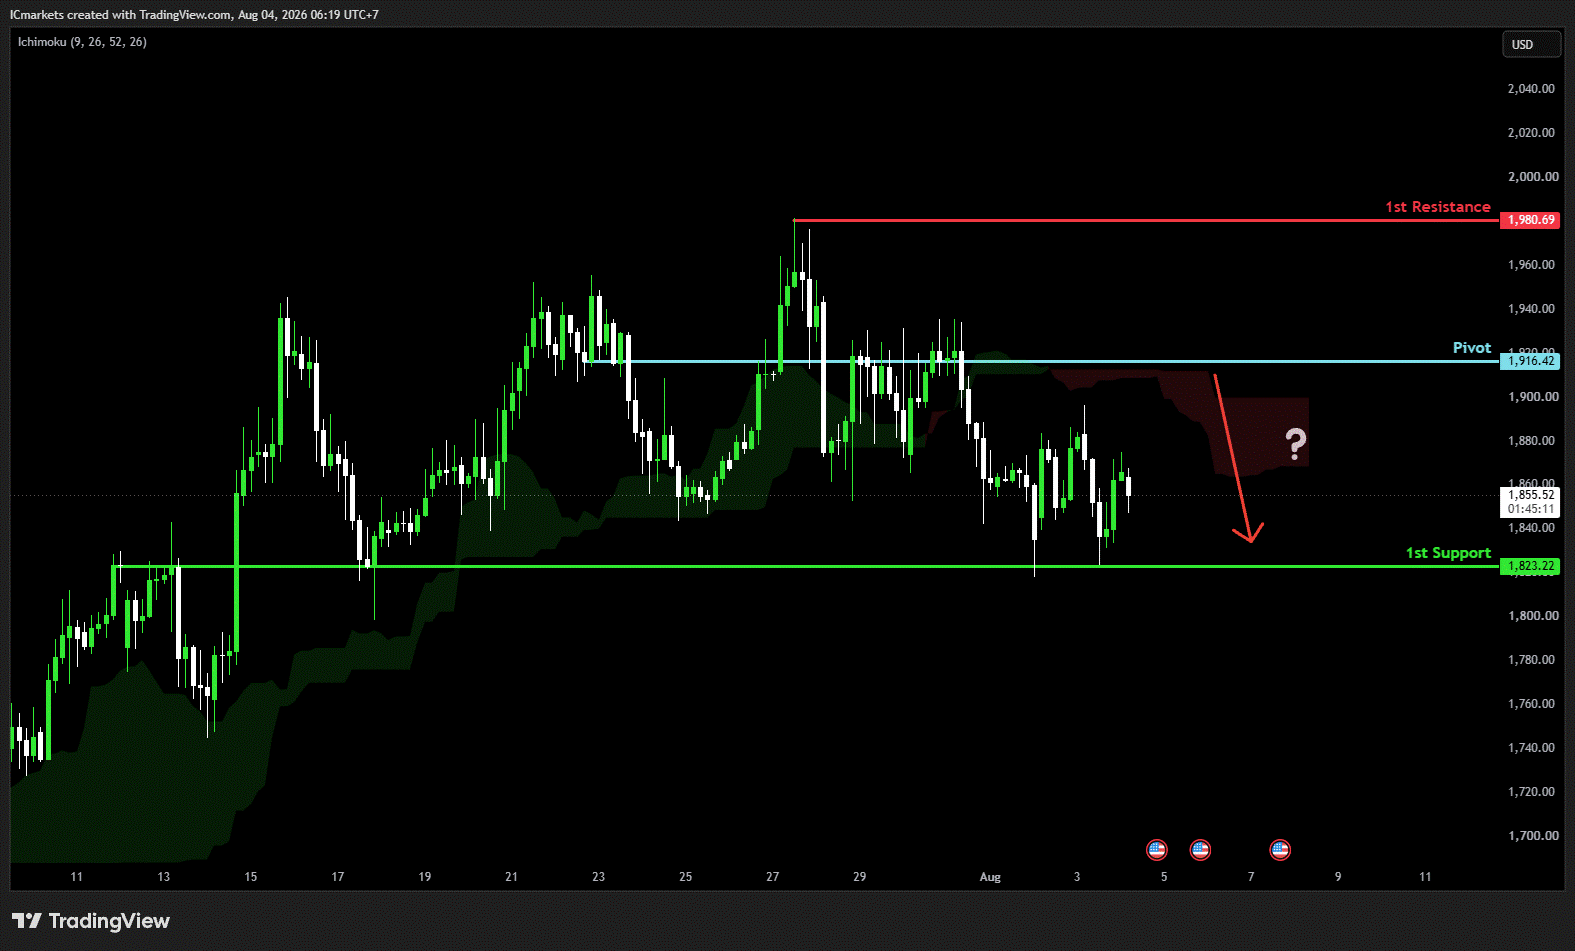
ETH/USD (Ethereum):
Potential Direction: Bearish
Overall momentum of the chart: Bullish
The price could see a short-term pullback toward the pivot before continuing its bearish move down toward the 1st support.
Pivot: 1,916.42
Supporting reasons: Identified as a pullback resistance, where selling pressures could intensify and potentially cap any upward retracement
1st support: 1,823.22
Supporting reasons: Identified as an overlap support, indicating a potential level where the price could stabilize once more.
1st resistance: 1,980.69
Supporting reasons: Identified as a swing high resistance, indicating a potential area that could halt any further upward movement.
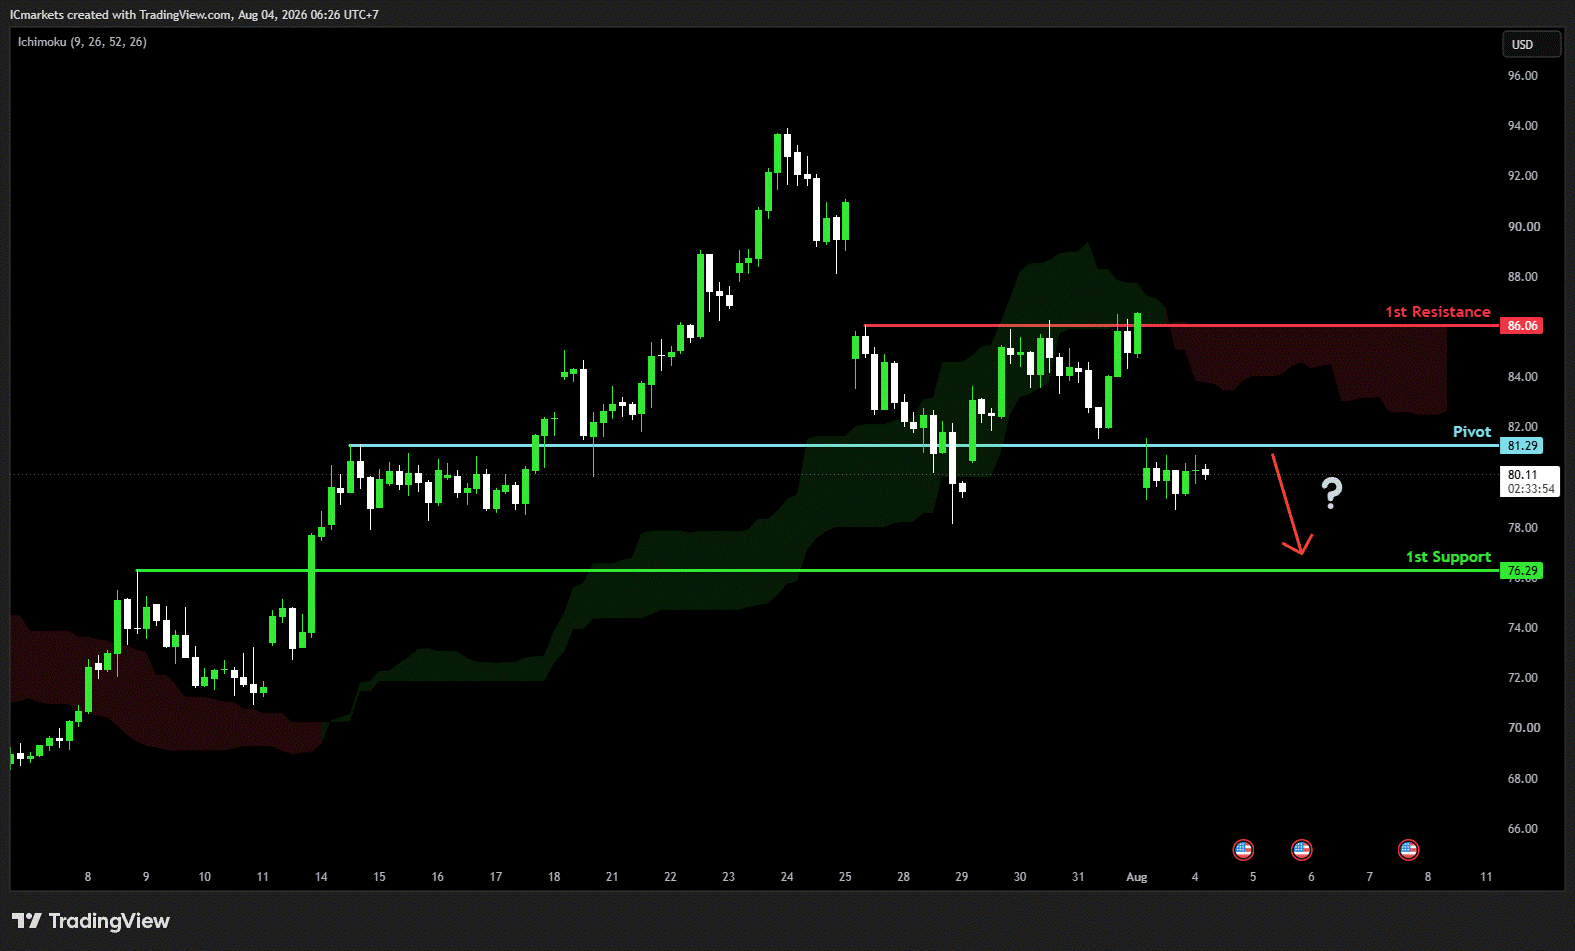
WTI/USD (Oil):
Potential Direction: Bearish
Overall momentum of the chart: Bullish
The price could see a short-term pullback toward the pivot before continuing its bearish move down toward the 1st support.
Pivot: 81.29
Supporting reasons: Identified as an overlap resistance, where selling pressures could intensify and potentially cap any upward retracement
1st support: 76.29
Supporting reasons: Identified as a pullback support, indicating a key level where the price could stabilize once more.
1st resistance: 86.06
Supporting reasons: Identified as a swing high resistance, indicating a potential area that could halt any further upward movement.
XAU/USD (GOLD):
Potential Direction: Bullish
Overall momentum of the chart: Bullish
The price could make a short-term pullback toward the pivot before rising again toward the 1st resistance
Pivot: 4,35.33
Supporting reasons: Identified as an overlap support, where renewed buying pressure could emerge to push the price higher.
1st support: 3,998.41
Supporting reasons: Identified as a low support, indicating a key level where the price could stabilize once more.
1st resistance: 4,117.29
Supporting reasons: Identified as an overlap resistance, indicating a potential area that could halt any further upward movement.
The accuracy, completeness and timeliness of the information contained on this site cannot be guaranteed. IC does not warranty, guarantee or make any representations, or assume any liability regarding financial results based on the use of the information in the site.
News, views, opinions, recommendations and other information obtained from sources outside of www.ic.com, used in this site are believed to be reliable, but we cannot guarantee their accuracy or completeness. All such information is subject to change at any time without notice. IC assumes no responsibility for the content of any linked site.
The fact that such links may exist does not indicate approval or endorsement of any material contained on any linked site. IC is not liable for any harm caused by the transmission, through accessing the services or information on this site, of a computer virus, or other computer code or programming device that might be used to access, delete, damage, disable, disrupt or otherwise impede in any manner, the operation of the site or of any user’s software, hardware, data or property.
Risk Warning: Trading in securities involves significant risk. Prices may fluctuate and securities can become entirely valueless. You may incur losses that exceed your potential profits, and in some cases, losses may exceed the amount you have deposited. Securities, futures, options, and contracts for differences are complex financial instruments and are not suitable for all investors. Engaging in such transactions requires a sound understanding of the associated risks. Please read and ensure you fully understand our Risk Disclosure.
Our leverage is dynamic and may change at any time. Such changes may affect your positions and margin requirements. You are responsible for monitoring your positions and maintaining sufficient margin at all times